Showing posts with label SSAS Concepts. Show all posts

Saturday, 31 May 2014

Definition of Table & Cube

Table:
         A table is an arrangement of columns and rows used to organize and position data.


Cube:
         The cube is a multidimensional data structure from which you can query for business information. You build cubes out of your fact data and the dimensions.

Above figure shows a Sales cube that was created from the fact table & dimensions. Consider the front face of the cube that shows numbers. The above cube has three dimensions: Time, Product and State.
It shows sold product information.
Each block of the cube is called a cell and is uniquely identified by a member in each dimension.
For Example, analyze the bottom –left corner cell that has the values 4,784 and $98,399. The values indicate the number of sales and sales amount. This cell refers to sales of product type of Ale in the state of Washington (WA) for July2008.
Notice that some cells do not have any value; this is because no facts are available for those cells in the fact table.

Tuesday, 29 April 2014

Unified Dimensional Model in SSAS

UDM (Unified Dimensional Model)

             The UDM is central to your Analysis Services database architecture.UDM is your friend because it helps you narrow the gap between end users and data they need. Analysis Services provides you with features that help you design a model that will serve the needs of end users. It provides you with a way to bring data from multiple heterogeneous sources into single model.

              Pre-UDM versions of Analysis Services only supported one fact table per cube. Therefore, only one data source could be used for specifying the fact table of cube.


Figure: The UDM provides a bridge between end users and their data

                  The above figure shows the architecture of the Unified Dimensional Model that is implemented in Analysis Services. It helps you to integrate data from various data sources such as Oracle, Sql Server, DB2 and TeraData into a single model that merges the underlying schemas into a single schema.To restrict end user view by using concept Perspectives in Analysis Services.
                  In OLAP, the data analyzed by end users is often historical data that might be a few days, months, or even year old. XML for Analysis (XMLA) standard, which allows client tools to retrieve data from Analysis Services. To write OLAP queries retrieve data within a few seconds.

The UDM consists of several components as follows
    • Data source – It represents a connection to the database where the data is stored.
    • Data source view (DSV) - Abstracts the underlying database schema. Although a DSV might seen redundant, it can be very useful by letting you augment the schema.
    • Dimensional Model – After you’ve created a DSV, the next step is to build the dimensional model.

Key elements of the UDM are as follows:
    • Heterogeneous data access support: UDM helps you to integrate and encapsulate data from heterogeneous data sources. It helps you combine various schemas into a single model.
    • Real time data access with high performance: The UDM provides end users with real time data access.     The UDM creates a MOLAP cache of underlying data. It helps in providing real time data access with     the speed of an OLAP database due to MOLAP cache.
    • Rich metadata, ease of use for exploration, and navigation of Data: UDM provides a consolidated view of the underlying data sources with the richness of metadata provided by the OLAP world. End users are able to exploit this Meta data to navigate and explore data in support of marking business decisions.
    • Rich analytics support: UDM provides rich analytics such as Key performance Indicators and Actions that help in understanding your business with ease and automatically take appropriate actions based on changes in data by using MDX (Multidimensional expressions) language.
    • Model for Reporting and Analysis: It provides you with the capability of not only querying the aggregated data that are typically used for analysis, but also has the ability to provide for detailed reporting up to the transaction level across multiple heterogeneous data sources.


Additional Features in Analysis services 2008:
    • In Analysis services 2008, the UDM is tightly integrated with data mining features. You can also create a data mining dimension from data mining model.


      • Several MDX functions are also added in Analysis services 2008.
      • In a dimension that can have hundreds of attributes. But in real time attributes with in dimension are not used in many queries. Only a subset of the attributes might be heavily used. Including unnecessary attributes and hierarchies in your UDM cases performance decreases in some cases.
             The Analysis Services 2008 design tools also allow you to better visualize the relationships between the attributes that you need and help you build a better dimension model. (It’s known as Fine Tuning Dimensions.)

             Merge UDM in Analysis Services 2008 is become a powerful, enterprise class product that you can use to build large scale OLAP databases and implement strategic business analysis applications against those databases.

             Finally you learn about the overall architecture of Analysis Services 2008 followed by the concept of the unified Dimensional Model (UDM), it helps you to have a unified view of your entire Datawarehouse.

Tuesday, 8 April 2014

Slowly Changing Dimension (SCD) & Types of SCD's

Slowly Changing Dimension

Dimension source data may change over time, rather than changing on regular schedule, time base. In Datawarehouse there is need to track changes in dimension attributes in order to report historical data.

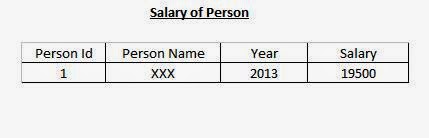
Slowly Changing Dimensions are often categorized into three types namely Type1, Type2 and Type3. The Following Example clearly explains the types of SCD’s.


Type 1: Updates existing record with modifications. (Does not Maintains History)

In the year of 2012, if the salary of the person to 19000, then the old values of the columns “Year” and “Salary” have to be updated with the new values. In this Type1, there is no way to find out the old salary of person Person Id – 1 in year 2012 since the table now contains only the new salary and year information.


Type 2: Creating an additional record (Does Maintains History)

In this Type 2, the old values will not be replaced but new values are stored in to another row of table. So at any point of time, the difference the old values and new values can be retrieved from database and early be compared. This is very useful for Real Time for reporting purposes.


Type 3: Creating New Fields. Keep old and new values in the existing row (Requires a design Change)

In this Type 3, the latest update to changed values can be seen. Example mentioned below how to add new columns and maintains old columns of that column changes as shown below.


The problem with the Type3 used in Real Time, if the salary of person1 changes, then added new columns to the same row that type u can change structure of cube every time.


Thursday, 27 February 2014

What is Hierarchy? & Types of Hierarchies with Example


What is Hierarchy? & Types of Hierarchies with Example

              A Hierarchy means arrangement of Items. In SSAS is based on multidimensional databases because it quite literally is. You do business analysis by observing the relationship between dimensions like Time, Sales, Products, Geography, and Accounts. Dimensions are most often made up of several hierarchies.

               Hierarchies are logical entities by which a business user might want to analyze Fact data. Each Hierarchy can have one or more levels. When you come to the end of the level of a tree you find a leaf. At the end of the levels of a hierarchy you find leaf members.

Types of Hierarchy
· Balanced Hierarchies
· Unbalanced Hierarchies
· Ragged Hierarchies

Balanced Hierarchies:
Completely balanced hierarchy means that all leaf (end) members would be equal distance from the Top level.

Date Hierarchy is the best example of Balanced Hierarchy


Unbalanced Hierarchies:
Unbalanced hierarchy means that all leaf (end) members would be not equal distance from the Top level.

Organization Chart is a Best Example of Unbalanced Hierarchy. There are different depths to the chain of supervisor to employee that is the leaf nodes are different distances from the top level node.


Ragged Hierarchies:
                Ragged Hierarchy means that all leaf (end) members are not directly linked with the next level of the tree. In this Hierarchy some intermediate levels are missing that reason low level members are connect with higher level members without any intermediate level members.

                An example of Ragged Hierarchy is shown below that contains levels Employees, TL’s and TM’s. With In Team Manager you have Team leader and Employees. Every time the employees reporting to the TL and finally all TL’s are submitted report to TM. But some of Employees like 4 & 5 directly reporting to TM without dependency of TL.

A Hierarchy in which the members descend to members in the lowest level with different paths is referred to as Ragged Hierarchy.